- Resources
- Delivery formats
- Sea level
- ESLD format
In this section
European Sea Level Data (ESLD) format
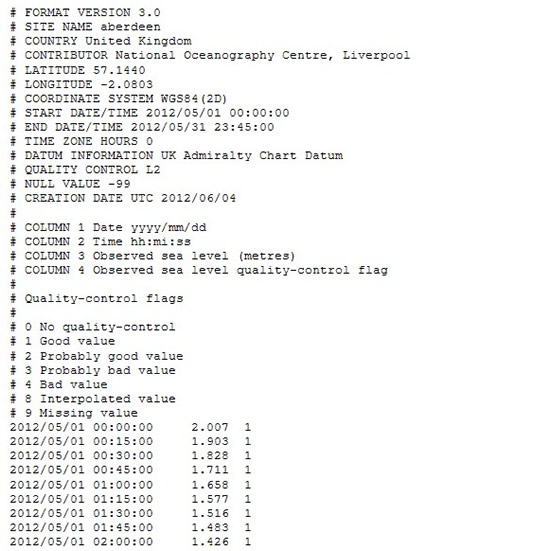
This is an ASCII output format for data from the European Sea Level Data portal. The following is an illustration of a ESLD format file. Further information regarding the file header and the data columns is provided below.

Header information
The file header information comprises metadata (information about the data) and definitions of the data columns listed in the file as described below. All header lines start with the # character.
Line 1 (FORMAT VERSION) — the declaration of the format version.
Line 2 (SITE NAME) — the site name of the tide gauge installation.
Lines 3 (COUNTRY) — the country name in English.
Lines 4 (CONTRIBUTOR) — the department or laboratory from which the data originate.
Line 5 (LATITUDE) — the latitude for the gauge. Latitude is in decimal degrees within the range -90.00000 to +90.00000 where negative numbers indicate south and positive numbers north.
Line 6 (LONGITUDE) — the longitude for the gauge. Longitude is in decimal degrees within the range -180.00000 to +180.00000 where negative numbers indicate west and positive numbers east.
Line 7 (COORDINATE SYSTEM) — the Coordinate Reference System for LATITUDE and LONGITUDE.
Line 8 (START DATE/TIME) — the start date and time of the data in the format yyyy/mm/dd hh:mi:ss. Times are presented as 24 hour clock.
Line 9 (END DATE/TIME) — the end date and time of the data in the format yyyy/mm/dd hh:mi:ss. Times are presented as 24 hour clock.
Line 10 (TIME ZONE HOURS) — the correction to be applied to time to obtain UTC.
Line 11 (DATUM INFORMATION) — the definition of a data value of zero.
Line 12 (QUALITY CONTROL) — the level, L1 or L2 as explained below, to which the data have been quality controlled.
Line 13 (NULL VALUE) — the numeric value used to indicate missing data.
Line 14 (CREATION DATE UTC) — the creation date of the data file expressed as yyyy/mm/dd UTC.
Lines 16, 17, 18, 19 (COLUMN 1, COLUMN 2, COLUMN 3, COLUMN 4) — a description of the data columns within the file.
Lines 20 onwards — additional useful information. For example, quality control flags and other pertinent comments.
Data values
Data values are listed as one per line as defined by the 'COLUMN' header information. Columns are space separated.
Quality control levels
There are two levels of quality control, namely
- Level 1 (L1)
Typically, automated quality control consisting of detection of strange characters, wrong assignment of date and hour, detection of spikes, and gaps (including interpolation of short gaps), out of range values (ideally based on extremes included in the metadata for each station), stability test (flagging values where there is no change in the magnitude of the sea level value after a number of time steps, the number of values to flag depending on the time interval), and, depending on the application even filtering to hourly values and computation of residuals. - Level 2 (L2)
L2 quality control builds on L1, and is normally applied to one or more years of data. L2 includes: tidal analysis, computation and inspection of residuals, generation of basic statistics (highs and lows, extremes), computation of daily, monthly and annual means, comparison with neighbouring tide gauges, comparison with models or predictions and detection of reference changes.


